Processing an off-process order
From requisition to payment, these cost reference figures show a difference of EUR 101 per order with an adapted process.
Source: Mastercard (reference figures provided).

Tail spend analysis and reporting
Connect spend, suppliers and activity with your priorities. Sourcing Force provides custom dashboards and KPIs to monitor the purchasing scope you track.
Market reference figures
From requisition to payment, these cost reference figures show a difference of EUR 101 per order with an adapted process.
Source: Mastercard (reference figures provided).
A compliance and visibility challenge in a tail spend market estimated at EUR 300 billion for European companies.
Sources: McKinsey and Mastercard (reference figures provided).
Supplier onboarding costs EUR 200–500, followed by EUR 70–200 in annual maintenance per supplier.
Sources: McKinsey and Mastercard (reference figures provided).
These industry reference figures are not Buy Made Easy customer results.
A one-off supplier need not become another ERP record.
Sourcing Force + Buy Made Easy
An incomplete spend table cannot distinguish orders that are costly to process from genuinely recurring needs.
Sourcing Force brings one-off purchasing flows together, connecting requests, suppliers and spend tracking in one place.
Activity assigned to Buy Made Easy as the single supplier can be tracked by category and site while retaining visibility of the underlying operations.
Inside Sourcing Force
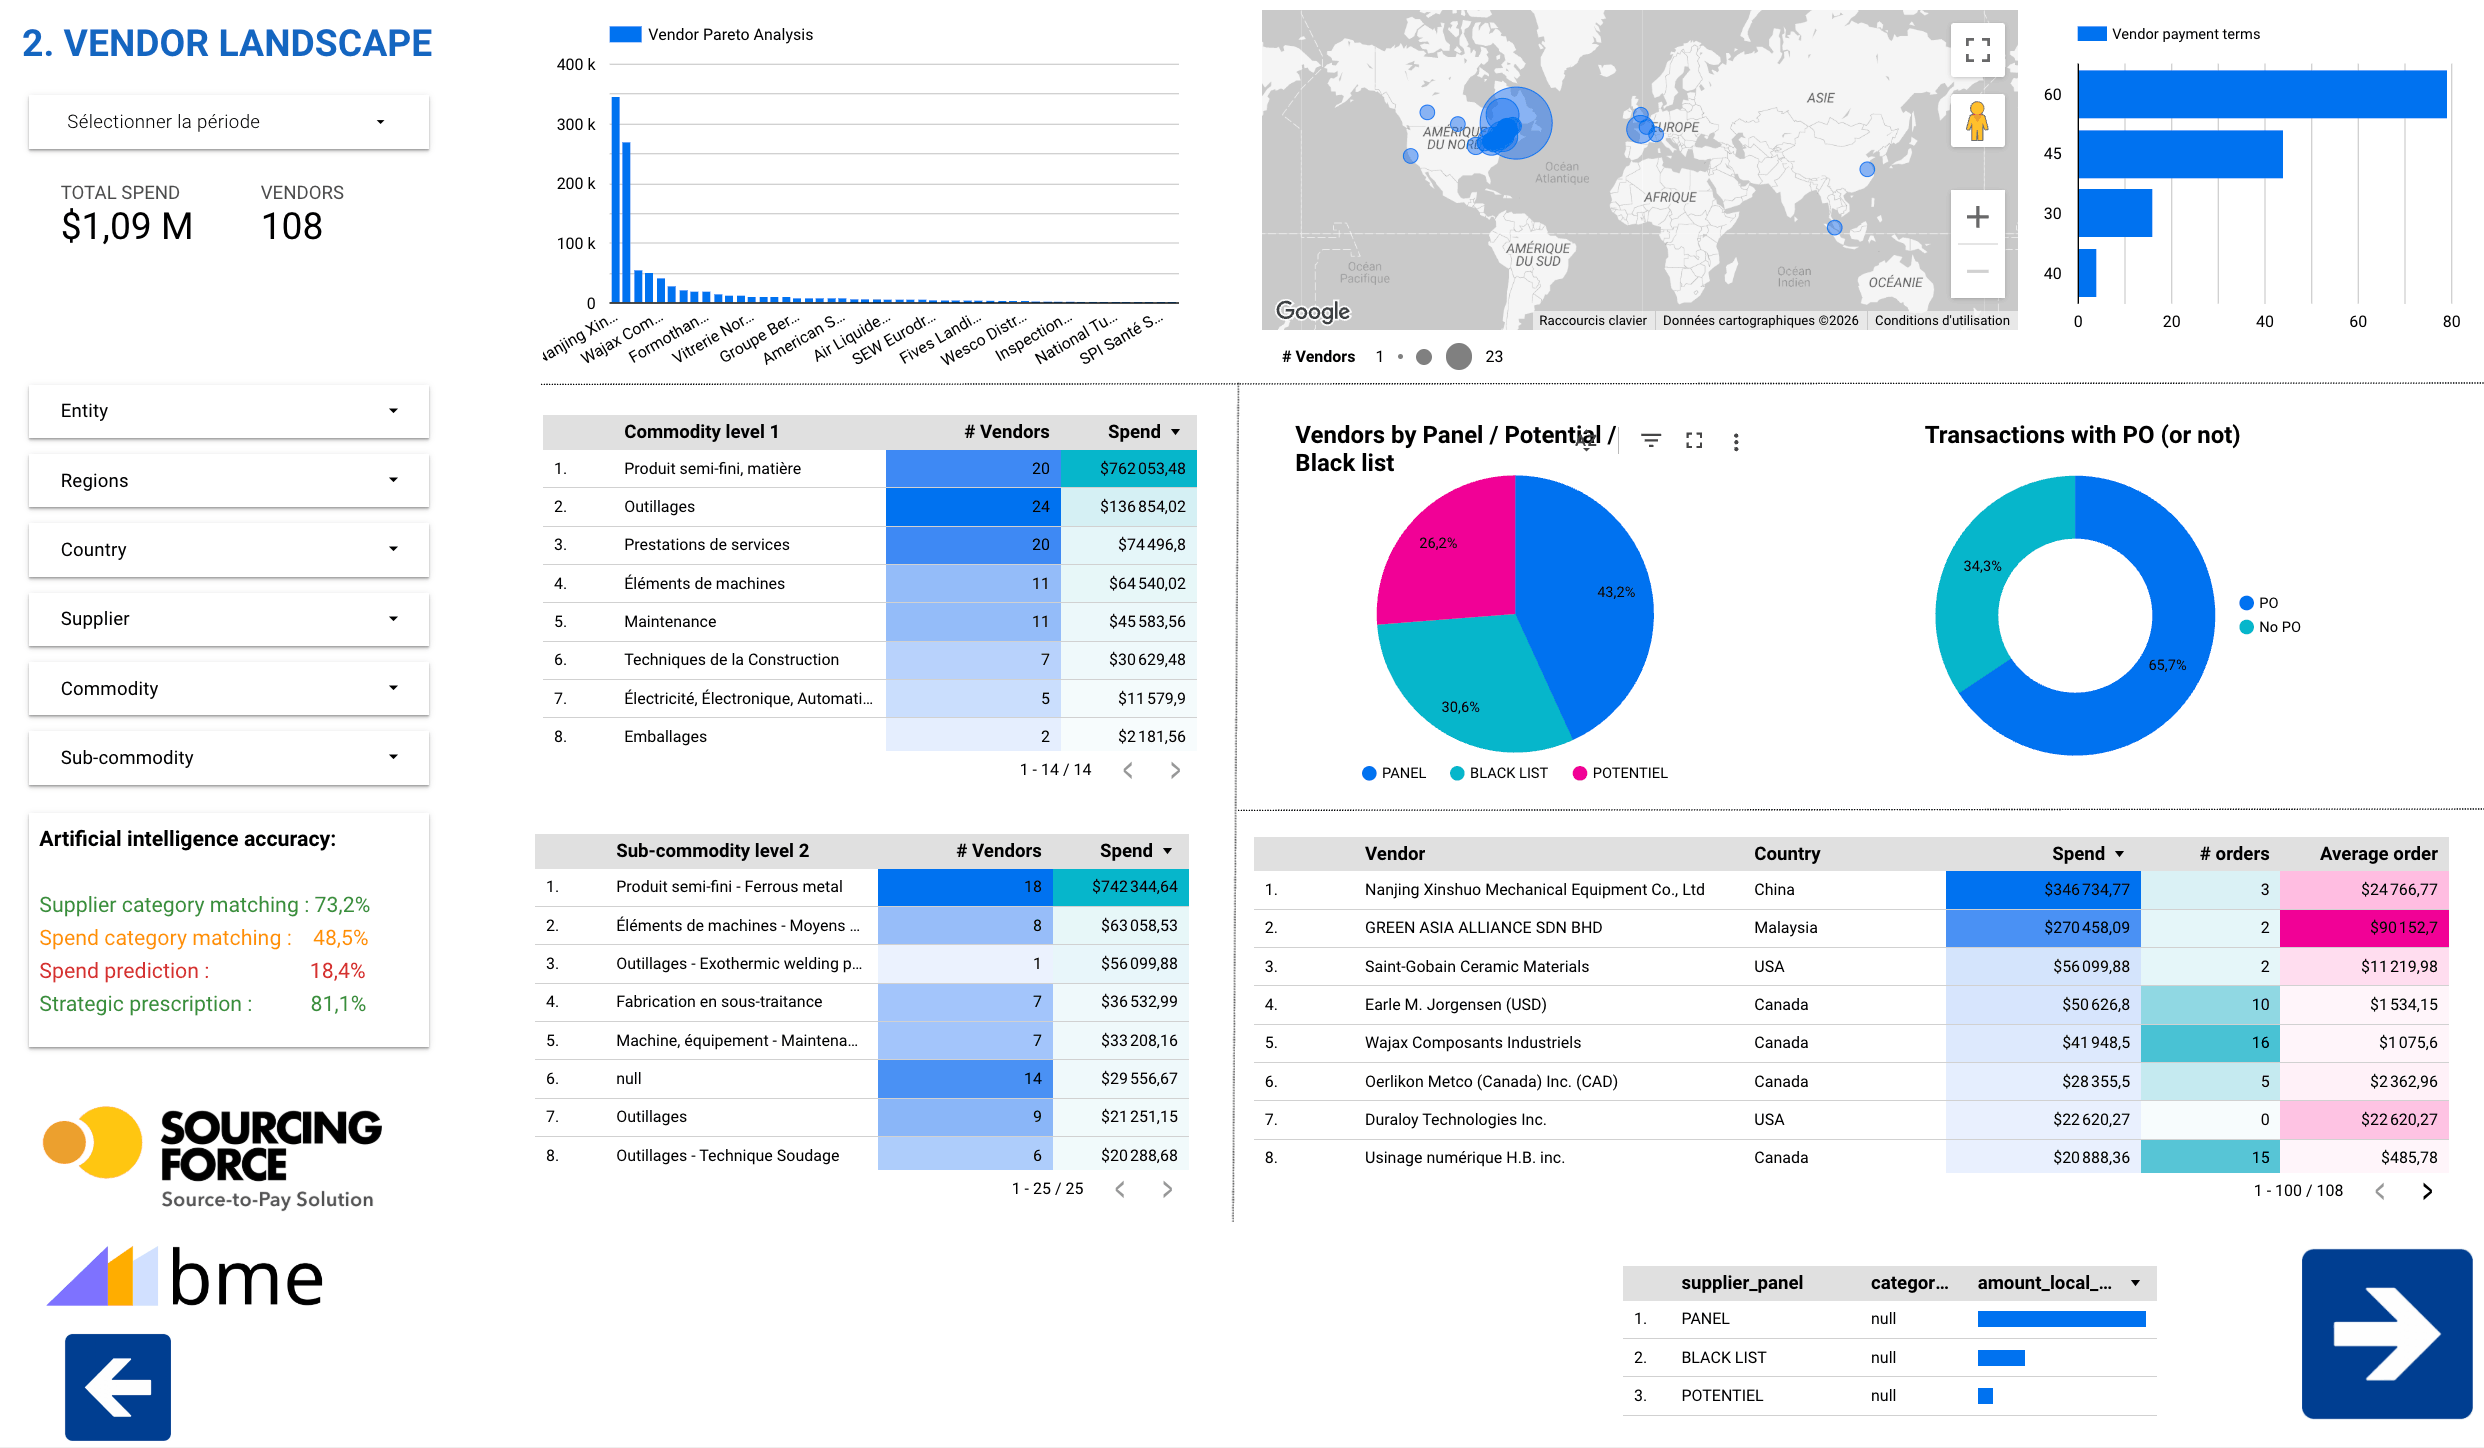
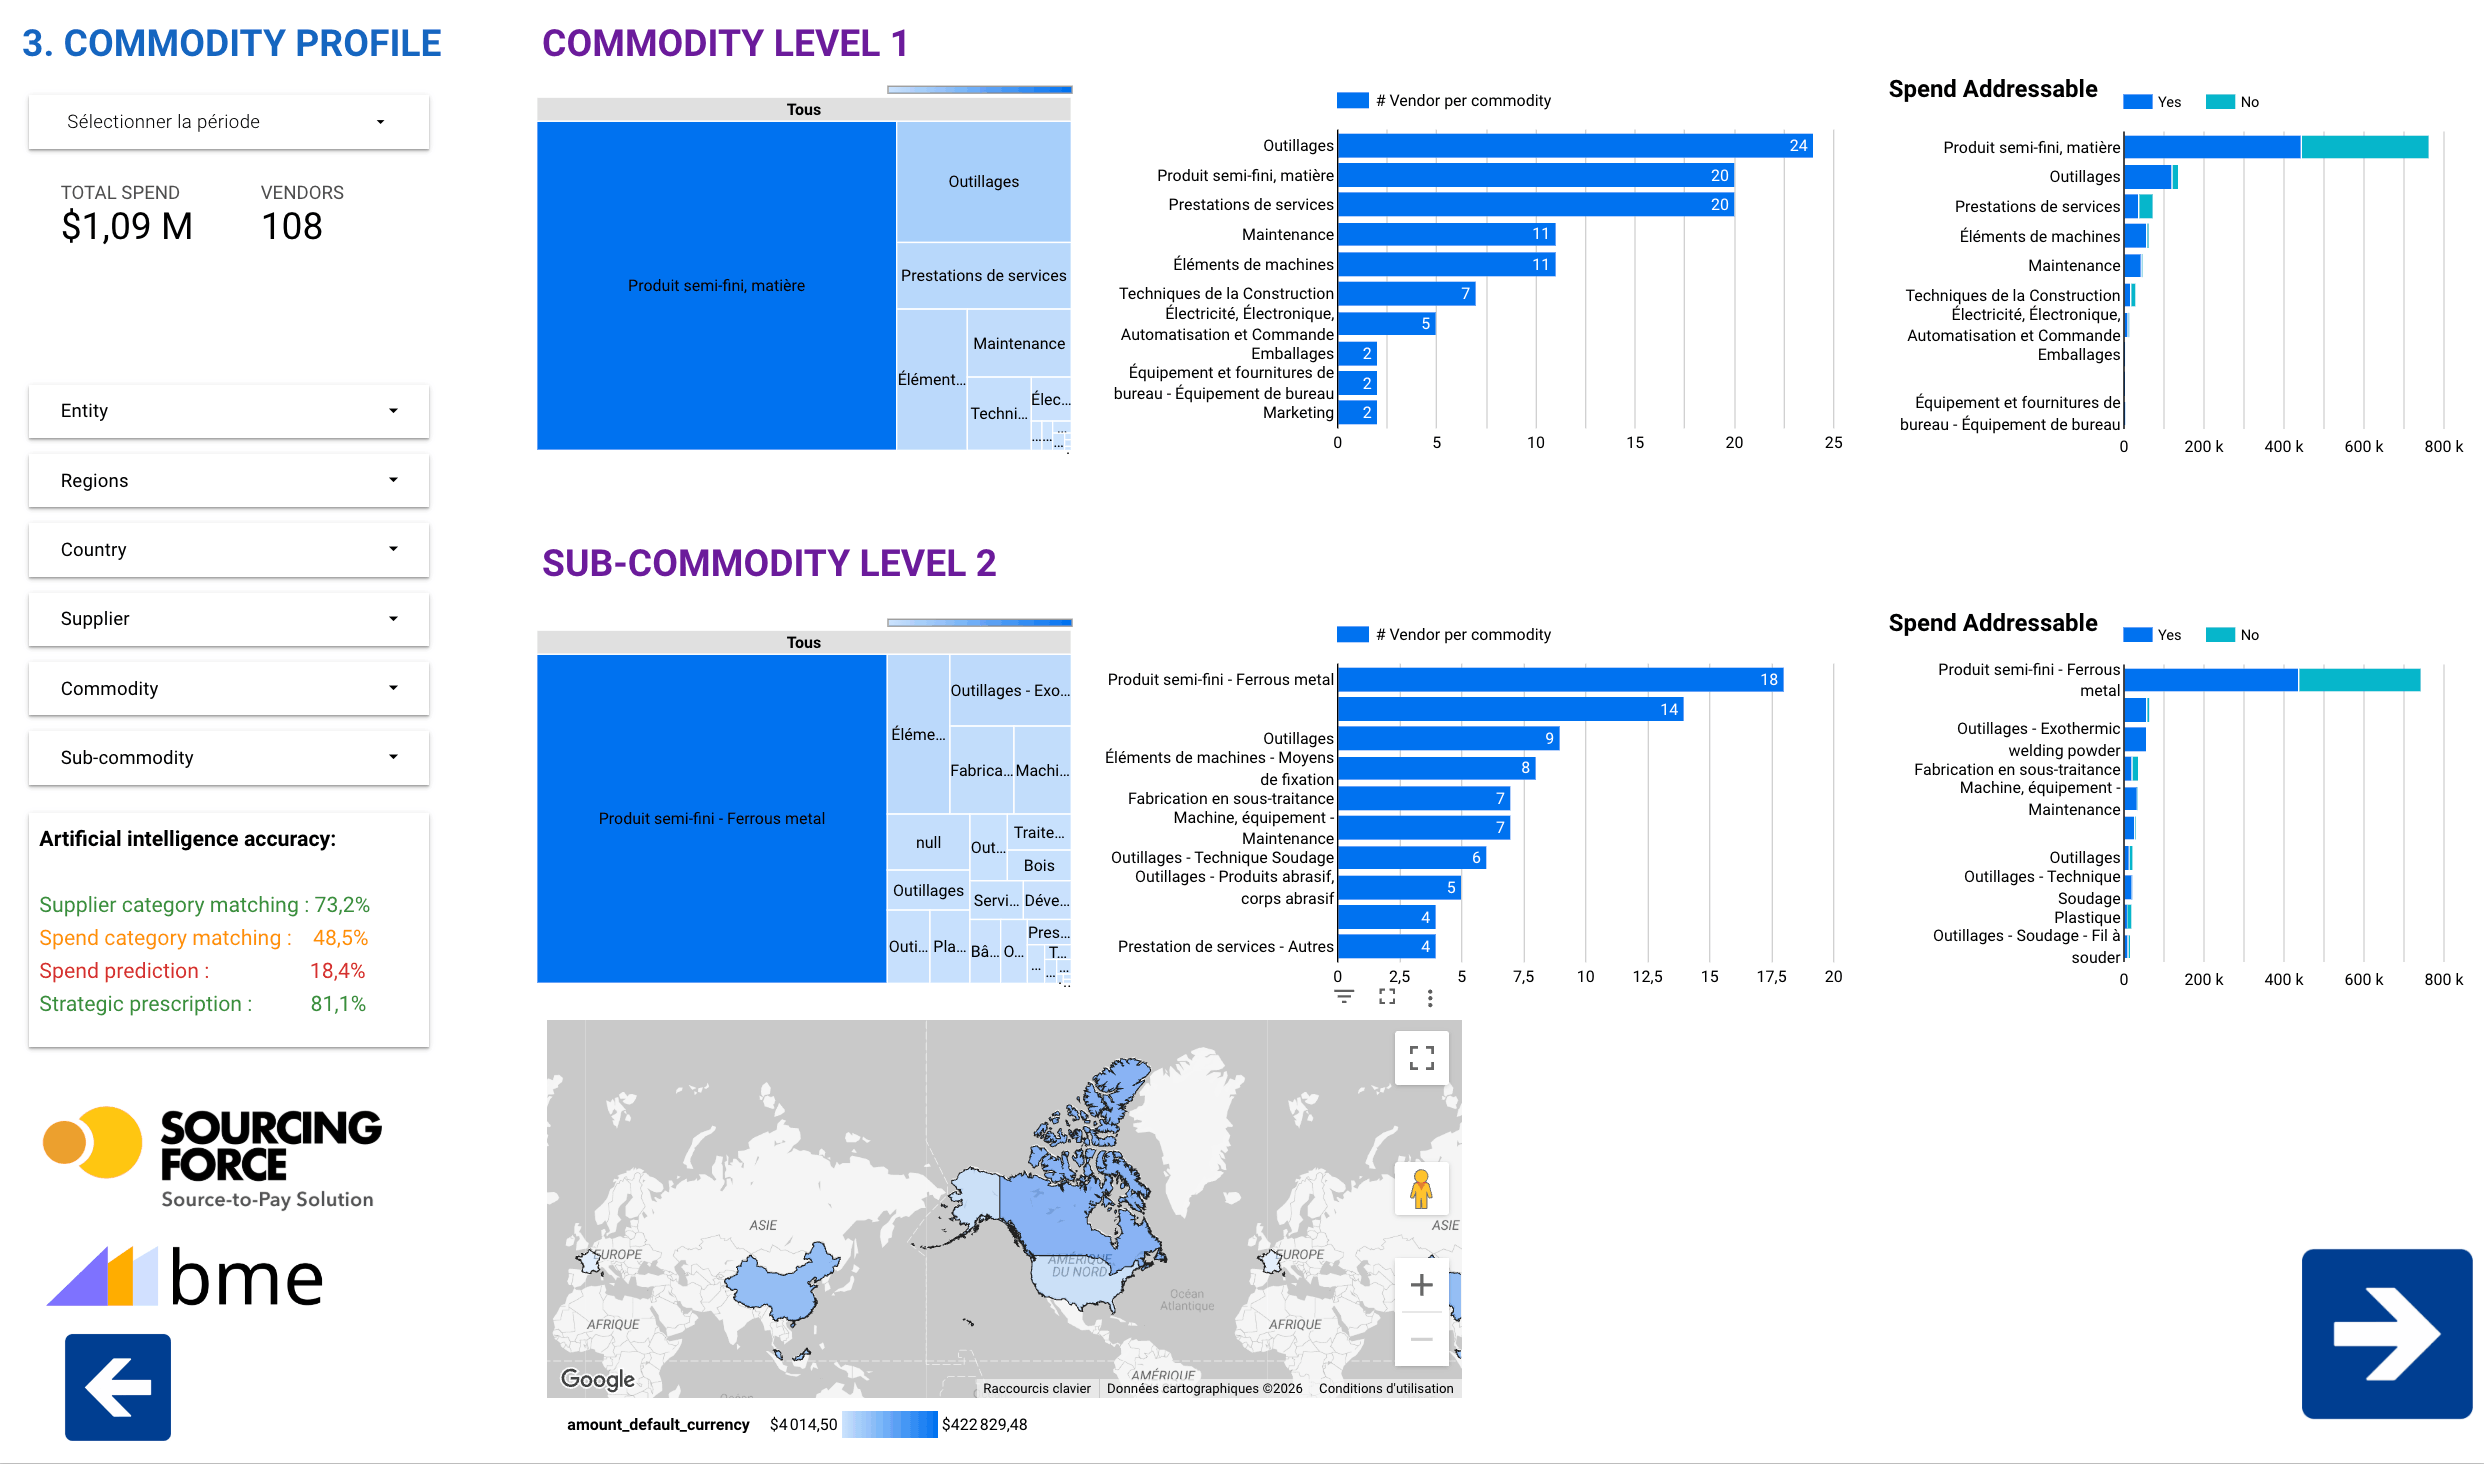
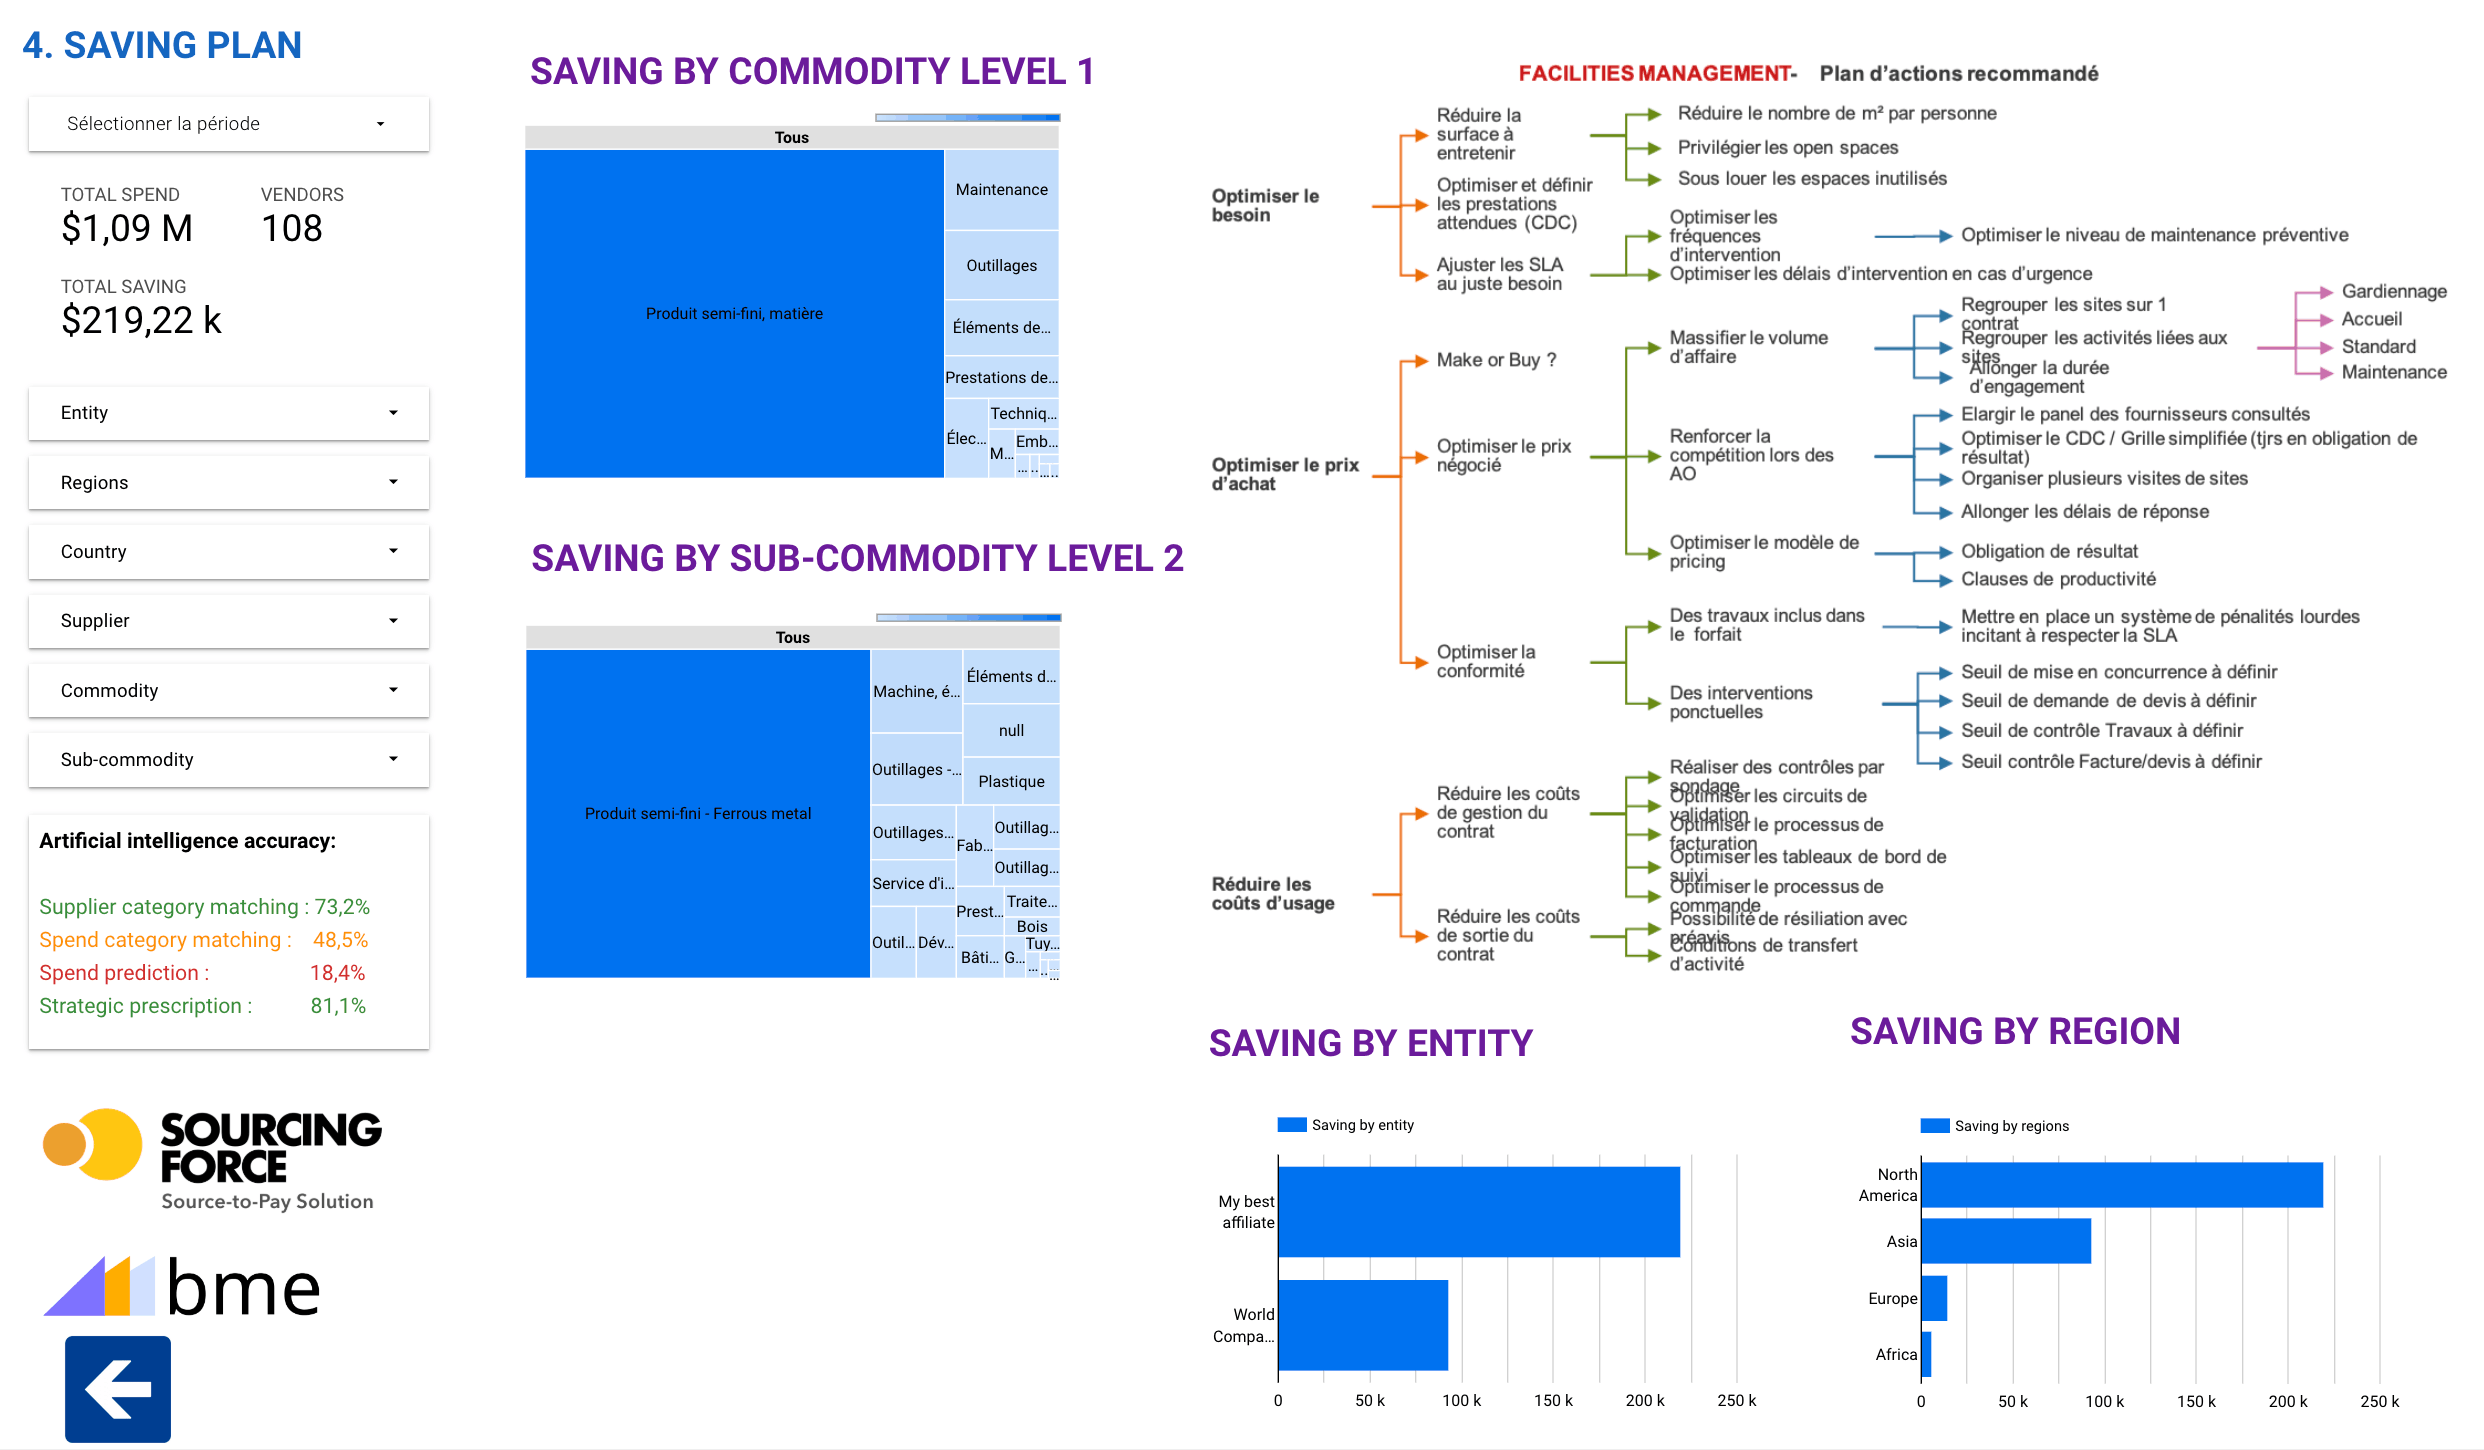
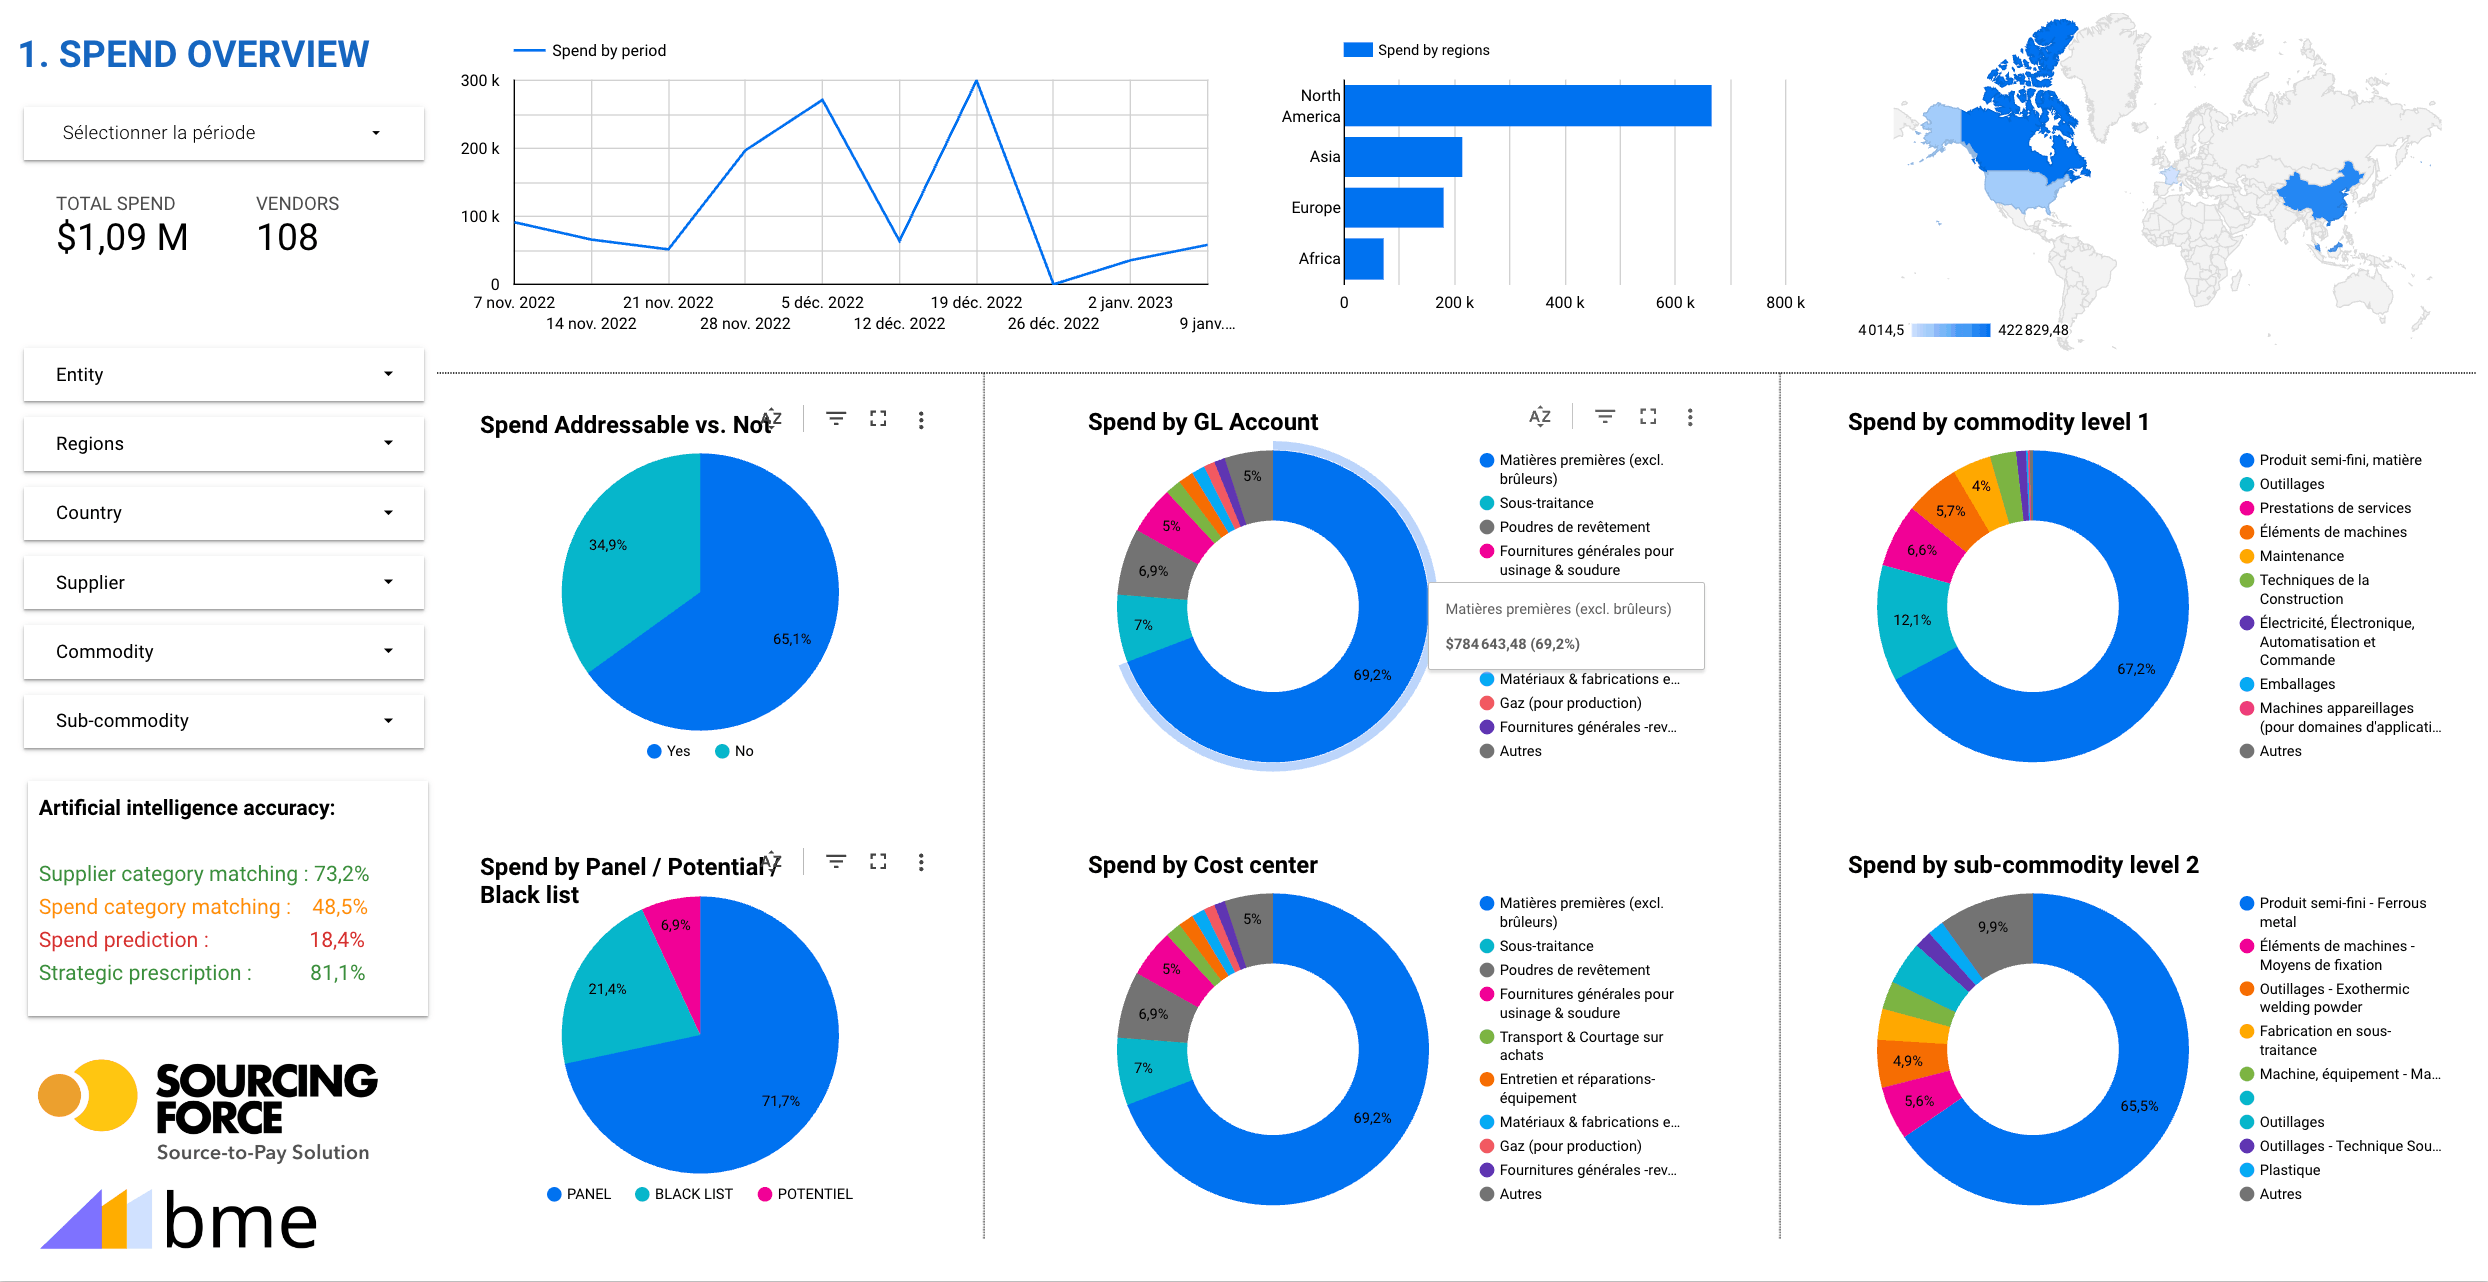
Interactive example
This demo report presents spend by region, supplier and category, followed by a savings plan. The values belong to the example and do not describe your organisation's performance.
The report is hosted by Google and loads at your request. An internet connection is required.
Definition
Procurement spend analysis brings purchasing data together to understand what is bought, from whom, by which entities and over what period. It helps you choose actions and then track their effects.
Tail spend describes fragmented expenditure that receives less active management. It often overlaps with class C spend but is not the same concept. Analysing it connects purchased value with transaction volumes, suppliers and site needs.
A small purchase can meet a critical need. Value helps segment spend; it does not determine the level of control on its own.
Review ABC classification ↗From data to decisions
Start with an explicit period and scope. Keep data quality and classification rules clear.
Gather available data: suppliers, orders, amounts, currencies, categories and sites. Identify missing data and matching rules.
Standardise labels and assign purchases to agreed categories. Preserve original data and have ambiguous cases reviewed.
Compare spend and activity by supplier, category or entity. Assess differences across a comparable scope and consider critical needs.
Direct recurring needs to a catalogue, improve request handling or consider outsourcing. Assign an owner and a tracking indicator.
An existing application screen
The dashboard presented in BME's offering brings together purchase values, orders, fees, new suppliers and supplier or order lists.
KPIs that support decisions
Sourcing Force provides custom dashboards and KPIs. Work with your teams to define them.
| Procurement question | Suggested measure | Possible decision |
|---|---|---|
| Where is spend fragmented? | Spend and order count by supplier and category. | Identify categories to consolidate or manage more closely. |
| Which needs recur? | Recurring items, requests or suppliers, depending on the data available. | Consider a catalogue or recurring workflow. |
| Where is the workload? | Transaction counts, pending requests and processing times where measured. | Review a step or the work assigned to a service provider. |
| Does the action change how people buy? | Compare before and after using the same reference period and a comparable scope. | Continue, adjust or stop the documented action. |
Data quality
Planned automated cleansing and classification uses need an explicit reference framework. Keep original categories, document the rules and review ambiguous cases so that proposed groupings can be understood.
Currency amounts, credit notes and duplicates need explicit handling rules. Define what each indicator measures and retain the limitations of the dataset.
Working with your systems
Cost centres, projects and categories follow the framework agreed with the client. Configured data or API exchanges support the agreed scope; define their update frequency and direction.
Sourcing Force complements your ERP/S2P. Analysis informs decisions; it does not transfer responsibility for rules, approvals, commitments or orders.
Scope your procurement ERP integration ↗Take action
Prepare your project
Choose a period and scope, then gather available supplier identifiers, dates, amounts, currencies, categories and sites. Specify how credit notes are handled and identify missing data. An initial assessment can cover a limited scope without claiming to represent all spend.
Keep a record of the original data, suggest a match or category, then ask the master data owner to review ambiguous cases. Document classification rules before applying them across the scope.
No. A purchase amount or order count describes activity. Measuring savings requires a baseline, a comparable scope and a method that distinguishes purchase prices, processing time and service costs. The analytics module alone does not deliver a universal saving.
Your next step
Let's discuss your class C purchases and how your organisation works.
Request your free assessment.
New content
Understand how spend management connects data, sourcing, contracts, buying channels, suppliers and performance beyond analytical reporting.
Learn how supplier normalization groups name variants, legal entities and corporate families to create reliable spend visibility.
Turn spend visibility into supplier leverage, rationalisation, channel compliance, price variance and sourcing actions.
Design a repeatable pipeline for spend ingestion, normalization, classification, enrichment, publication and quality monitoring.
A practical operating model for fragmented data, weak ownership, low adoption, unmanaged tail spend and savings leakage.
Align definitions for total, addressable, managed, contract, maverick, tail, direct and indirect spend.
A practical method to combine automated classification with confidence scores and expert review, with controls, metrics, ownership and implementation steps.
A practical method to turn invoice lines into a traceable category view without hiding uncertainty, with controls, metrics, ownership and implementation steps.
A practical method to define labelled samples, error costs and fit-for-purpose accuracy, with controls, metrics, ownership and implementation steps.
A practical method to preserve financial, category, supplier and operational views in one model, with controls, metrics, ownership and implementation steps.
A practical method to test whether every reported number can be traced to source and rule, with controls, metrics, ownership and implementation steps.
A practical method to link fragmented overhead spend to controllable margin drivers, with controls, metrics, ownership and implementation steps.